I mentioned yesterday that although I expected upside I did not believe the market was ready to blast off to new highs just yet. The nature of today's advance i.e. an emotional gap up and run suggests this be the case. If anyone has been reading this blog from when I first started it, I have stressed a few times before that the way the market moves up or down is just as important as the closing price of the market itself.
Sustainable advances or declines tend to be orderly affairs. In the case of an uptrend for example, a healthy, sustainable advance is characterized by the market starting off the day weak or flat and then gradually rising making a series of higher highs and higher lows closing near the high of the day. This signifies "wall of worry" behavior which all bull markets must climb. Of course, not everyday has to be like this for a healthy advance to continue but certainly these types of gap up and run days are indicative of emotional trading which are NOT sustainable. Think of days like today like a boost of energy you get from a sugar rush.
Simply looking at a chart and concluding such and such a pattern exists without taking into account the nature of the advance/decline is folly. Here's a good example of what I'm talking about. Take for instance 2 supermodels. Both are equally gorgeous in appearance but one of them got that way by starving herself and taking drugs while the other got there by healthy dieting and exercise. Which girl would you rather date? Obviously the latter but unless you knew about these "internal" differences you would be indifferent about either girl judging both on appearance alone.
For the past several months the market has been characterized by emotional gap and run days like today both on the upside and downside which is why we have gone essentially nowhere on a net basis due to the unsustainably of such moves. This is a symptom of a market that is being dominated by short term traders getting whipsawed left, right and center. After the collapse of last year the concept of buy and hold is dead and even the so called "professionals" on TV who always preached investing for the long term are now frequently advocating that investors become active with their investing. The problem with this is that day to day volatility will increase significantly as the herd of buffalos stampede from one edge of the cliff to the other. The proliferation of all these 2x and 3x ETFs simply adds fuel to the fire. There needs to be enough long term investors to buy and hold for the market to start acting "normal" again.
But there's no sense in hoping for things to get normal. You have to play the cards you are dealt. I believe this entire move today will get retraced in the not so distant future. If the market closes at about current levels (SPX 925) it will be fully ST overbought. I also believe that the H&S pattern isn’t necessarily invalidated just yet…sometimes a second right shoulder is formed to shake out weak bears.
Wednesday, July 15, 2009

Don't say I didn't warn you
Late Thursday I said look for a retest of the lows i.e. 870ish either Friday or Monday before a surge higher. We got that and now with Intel blowing out their numbers tonight, the market is poised for a large gap up on Wednesday. The head and shoulders pattern bears were salivating over has led to one of those Charlie Brown moments when he runs to kick the football that is being held by Lucy only for her to yank it away at the last moment leaving poor Charlie Brown flattened on his back. The funny thing about it is that Charlie Brown seems to fall for the same trick over and over again. On each attempt he is somehow convinced that this time he will be successful but never once did he ever kick that ball.
I warned right here well in advance that if the market had made an important top in June, don't expect it to be easy to capitalize on the downside because traders and investors have been very quick to turn bearish on only marginal declines. Mr. Market will continue to punish this type of behavior untill enough people give up on the notion that the market is going to crash and restest the lows. Only when enough people fully embrace the notion that the worst is over and there will be no retest or double dip reccession will the market have the potential to drop significantly.
I still believe the market is not in a position to make a run for new highs just yet either, but the longer the market maintains this sideways holding pattern, the more likely it will make a signficant upleg higher latter on because in another few weeks or so, the market will have fully worked off it's IT overbought condition and actually become slightly IT oversold.
After the Goldman Sachs report, this Intel news is now the second bell weather stock in a row to have blown past its expectations. Should you be suprised? I'm not. Here's what I said on May 11th
Analysts overestimated earnings by an average 13 percentage points in each period between the third quarter of 2007 and the end of 2008. Better-than-expected first-quarter results haven’t prompted them to boost forecasts for the rest of 2009. Instead, they’ve ratcheted down predictions as the first global recession since World War II weakened demand.
So, despite the fact that earnings were much better than expected analysts are LOWERING their forecasts. Is this yet again anchoring I see? And the strange thing is that the "adjusting" is going in the opposite direction! Thus, it looks like analysts are doing what I now call "anchoring and negative adjusting" or I suppose you can also call it "anchoring squared"
I warned right here well in advance that if the market had made an important top in June, don't expect it to be easy to capitalize on the downside because traders and investors have been very quick to turn bearish on only marginal declines. Mr. Market will continue to punish this type of behavior untill enough people give up on the notion that the market is going to crash and restest the lows. Only when enough people fully embrace the notion that the worst is over and there will be no retest or double dip reccession will the market have the potential to drop significantly.
I still believe the market is not in a position to make a run for new highs just yet either, but the longer the market maintains this sideways holding pattern, the more likely it will make a signficant upleg higher latter on because in another few weeks or so, the market will have fully worked off it's IT overbought condition and actually become slightly IT oversold.
After the Goldman Sachs report, this Intel news is now the second bell weather stock in a row to have blown past its expectations. Should you be suprised? I'm not. Here's what I said on May 11th
Analysts overestimated earnings by an average 13 percentage points in each period between the third quarter of 2007 and the end of 2008. Better-than-expected first-quarter results haven’t prompted them to boost forecasts for the rest of 2009. Instead, they’ve ratcheted down predictions as the first global recession since World War II weakened demand.
So, despite the fact that earnings were much better than expected analysts are LOWERING their forecasts. Is this yet again anchoring I see? And the strange thing is that the "adjusting" is going in the opposite direction! Thus, it looks like analysts are doing what I now call "anchoring and negative adjusting" or I suppose you can also call it "anchoring squared"
Friday, July 10, 2009
Some encouraging signs
The market has been acting pretty much exactly how I expected....so now what? I believe another retest of the lows at 870ish is in store but I gotta warn you bears out there....the bear side is getting pretty crowded yet again. Take for instance the latest AAII sentiment poll. 55% of respondants are bearish while only 28% are bullish. That's about a 2:1 ratio of bears over bulls. The last time these guys were this bearish was just after the market low in March...thus, the wall of worry is being rebuilt quite rapidily it seems.
Despite the fact that the market had a 40% rally off the March lows, not once did bulls ever outnumber bears by 2:1. The highest it ever got was about 1.3:1 in mid June which shows that people only turned more bullish begrudgingly kicking and screaming...but all it took was about an 8% decline to see these same people embrace the bear camp with open arms. This folks is the classic snake bite psycology in effect. Memories of catastrophic losses are still very fresh and so investors have their gaurds up at the first sign of weakness.
Take a look at the financial headlines and opinions out there from the typcial pundit. The unanimous consensus right now is that any recovery will be slow and quite possibly has already stalled. Even if this is the case, it will difficult for the market to drop sustantially when expectations are low like this. The suprise factor actually favors the bulls here unless we see the economy fall off a cliff big time.
Everyone seems to be talking about this head and shoulders pattern in the market. The question amongst traders out there is when it breaks and picking the right spot to go short. Not a soul out there it seems, thinks that this correction may be just about over. I don't care how good of technical analyst you think you are or if such and such momentum indicators is giving a buy/sell signal, the market tends to go in the direction that causes the most ammount of pain for traders as per the motto of this blog. I've seen it happen time and time again.
So, if everyone has the same trade on who's the sucker that is going to have to lose for you to win? As the old saying goes, if you can't find the sucker at the poker table that sucker is you.
Despite all this, there is still the potential for at least a retest of the lows we saw Wednesday in the comming day(s)....quite possibly tommorow or Monday....but be very carefull if you play the short side because the short side is crowded enough for the market to see a vicious snap back rally at anytime. Next week I belive will be a bullish week if we can see the market retest those lows.
For now I continue to play things 1 day at a time keeping an open mind to both sides of the market.
Despite the fact that the market had a 40% rally off the March lows, not once did bulls ever outnumber bears by 2:1. The highest it ever got was about 1.3:1 in mid June which shows that people only turned more bullish begrudgingly kicking and screaming...but all it took was about an 8% decline to see these same people embrace the bear camp with open arms. This folks is the classic snake bite psycology in effect. Memories of catastrophic losses are still very fresh and so investors have their gaurds up at the first sign of weakness.
Take a look at the financial headlines and opinions out there from the typcial pundit. The unanimous consensus right now is that any recovery will be slow and quite possibly has already stalled. Even if this is the case, it will difficult for the market to drop sustantially when expectations are low like this. The suprise factor actually favors the bulls here unless we see the economy fall off a cliff big time.
Everyone seems to be talking about this head and shoulders pattern in the market. The question amongst traders out there is when it breaks and picking the right spot to go short. Not a soul out there it seems, thinks that this correction may be just about over. I don't care how good of technical analyst you think you are or if such and such momentum indicators is giving a buy/sell signal, the market tends to go in the direction that causes the most ammount of pain for traders as per the motto of this blog. I've seen it happen time and time again.
So, if everyone has the same trade on who's the sucker that is going to have to lose for you to win? As the old saying goes, if you can't find the sucker at the poker table that sucker is you.
Despite all this, there is still the potential for at least a retest of the lows we saw Wednesday in the comming day(s)....quite possibly tommorow or Monday....but be very carefull if you play the short side because the short side is crowded enough for the market to see a vicious snap back rally at anytime. Next week I belive will be a bullish week if we can see the market retest those lows.
For now I continue to play things 1 day at a time keeping an open mind to both sides of the market.
Thursday, July 9, 2009
Bulls looking weak today
Earnings released so far have been better than expected but so far the market is yawning. Bonds are down and the Nasdaq 100 (leading sector) is relativley weak which aren't good signs for sustained advance. No significant follow through from the reversal yesterday so far suggests more weakness later on either later on in the day or tommorow. I said yesterday that I had the feeling too many traders were looking to play an oversold bounce and so these guys and gals will likely start getting nervous cutting and running if we don't get any upside traction soon.
Wednesday, July 8, 2009
False Breakdown #1
I warned about the potential for a false breakdown from the widely advertised H&S pattern on the SPX. The market is ST oversold and still has a chance to make a little bounce but the NASDAQ/NYSE ratio is still at a high 1.88 indicating that any rally attempt here likey will be limited for now unless of course traders do an about face. However, there's plenty of ST fuel for a move back to 900. There's also an unfilled gap at 920. Like I said before, if this is the begining of another major downleg, don't expect it to be easy to profit from.
One thing the bulls got going for them is the VIX. I made a post about a week ago claiming how the behavior in the VIX was signalling complacency by making lower lows as the market made lower highs. This behavior is no longer the case. Today we saw a bit of the opposite behavior whereby the VIX popped signficantly even though the marke was only showing moderate weakness at best and it remained in the green even though the market closed essentially flat.
Bottom line: look for the market to make a rally attempt in the comming days to about 900...but be very careful. I think a lot of people now are expecting a bounce tommorow so it may end up being a weak one followed by a another retest of the lows on Friday. Again, this is guesswork here because obviously headline risk will have an impact and one must adapt accordingly. I always keep an eye on the intraday put/call ratio to fine tune my intraday outlook as well.
I continue to stress that the key to success in this type of market is buying on weakness selling on strength especially at those points when it seems difficult to do so. The tough trade is usually the right trade. I tend to either wait for some sort of confirmation of a turning point or capitulatory type behavior when making my entries. For example, today I bought calls on CYOU at about 12pm on the double bottom. I sold them shortly after for a quick gain anticipating a turnaround in the market. Part of the reason I sold so soon was that it didn't pop as much as I thought it would given it's strong relative strength since it IPOed a few months ago. The other reason was that given how these were OTM calls with 8 trading days untill expiry the theta burn is quite high and so if the pop in the stock ended up fizzling by EOD, any moderate gap down the next day would result in the call getting crushed without giving me a chance to cut losses effectivily thereby putting me in the a "dear in the headlights" position. I REFUSE to be in such a position and with earnings season kicking off, it makes the market more prone to significant gaps.
Regarding yesterday's mystery chart for anyone who cares (seems like nobody) here's what ended up happening...
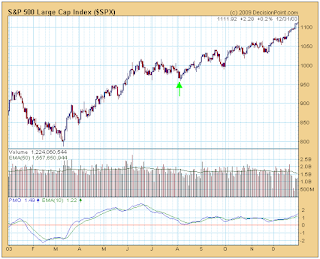
Where you suprised? This was the market in 2003 by the way....
One thing the bulls got going for them is the VIX. I made a post about a week ago claiming how the behavior in the VIX was signalling complacency by making lower lows as the market made lower highs. This behavior is no longer the case. Today we saw a bit of the opposite behavior whereby the VIX popped signficantly even though the marke was only showing moderate weakness at best and it remained in the green even though the market closed essentially flat.
Bottom line: look for the market to make a rally attempt in the comming days to about 900...but be very careful. I think a lot of people now are expecting a bounce tommorow so it may end up being a weak one followed by a another retest of the lows on Friday. Again, this is guesswork here because obviously headline risk will have an impact and one must adapt accordingly. I always keep an eye on the intraday put/call ratio to fine tune my intraday outlook as well.
I continue to stress that the key to success in this type of market is buying on weakness selling on strength especially at those points when it seems difficult to do so. The tough trade is usually the right trade. I tend to either wait for some sort of confirmation of a turning point or capitulatory type behavior when making my entries. For example, today I bought calls on CYOU at about 12pm on the double bottom. I sold them shortly after for a quick gain anticipating a turnaround in the market. Part of the reason I sold so soon was that it didn't pop as much as I thought it would given it's strong relative strength since it IPOed a few months ago. The other reason was that given how these were OTM calls with 8 trading days untill expiry the theta burn is quite high and so if the pop in the stock ended up fizzling by EOD, any moderate gap down the next day would result in the call getting crushed without giving me a chance to cut losses effectivily thereby putting me in the a "dear in the headlights" position. I REFUSE to be in such a position and with earnings season kicking off, it makes the market more prone to significant gaps.
Regarding yesterday's mystery chart for anyone who cares (seems like nobody) here's what ended up happening...

Where you suprised? This was the market in 2003 by the way....
Riddle me this....
Not suprised by today's action at all as per my previous comment.
Take a look at the chart below. Looks pretty familar doesn't it (no, this is NOT a chart of the current market)? If anyone is actually reading this blog (LOL!) tell me what do you think the next major move would be in this chart a)up b)down c) sideways?
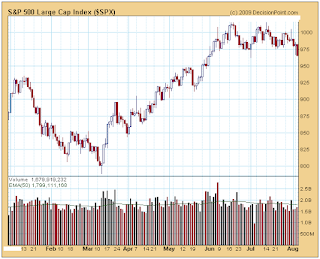
Here's a piece of info that may be of help...the VIX was at 24 at the time.
Take a look at the chart below. Looks pretty familar doesn't it (no, this is NOT a chart of the current market)? If anyone is actually reading this blog (LOL!) tell me what do you think the next major move would be in this chart a)up b)down c) sideways?

Here's a piece of info that may be of help...the VIX was at 24 at the time.
Monday, July 6, 2009
Warning! NASDAQ/NYSE volume ratio has poped to extreme level again!
At 2.69 I don't think I recall this ratio ever being higher. I first made mention of this indicator right near the peak of the rally in mid June when it hit a day reading that was almost as high as the level reached at the peak of the bull market in October 2007. Now...gulp...the ratio is HIGHER than it was in mid October 2007! And the fact that this indicator is hitting record highs in the face of market weakness makes it even more of a bad omen. I am now seeing a cluster of spikes of this ratio reaching 1.9 or above during the past 3 weeks. Prior to now, during the past 2 years these "cluster spikes" occured 4 times: most of October 2007, early-mid May 2008, most of August 2008, mid-late Oct 2008. During all of these periods the market was forming notable tops which were ALL followed by nasty drops in the market. Keep in mind, the market didn't fall apart right away at the first sign of froth but after 2-4 weeks of the initial froth, it did. We are now in that same danger zone.
Does this mean we are going to see massive drops like we did following the periods I just mentioned? Quite possibly yes, but not neccessarily. In bear markets, greed/froth, such as what this indicator measures, gets punished severely because the natural evironment in a bear market is fear not greed given that fundamentals are deteriorating. In bull markets, investors don't get punished as much for being greedy (until the very end of it) because optimism is the natural emotion. Therefore, it could very well be the case that the market has a much milder decline this time around compared to the prior 4 periods I highlighted. That's of course we are assuming we are in a bull market. Only hindsight will allow us to know for sure.
Thus, for now it is safe to assume in my opinion that any rallies from here will be quite limited, i.e. won't exceed the high put in June. It also safe to assume that we haven't seen the low point yet of this decline. Be advised like I said before that the market isn't going to make things easy for the bears to captialize because bears by nature are weak handed. Expect to see plenty of headfake rallies and declines to create maximum frustration.
The topping process could very well last another week or 2. I suspect we could see break down of this widely followed head and shoulder's patter to about 880-875 or so followed by a vicious snap back to 900 but that's just a guess. I'm taking things 1 day at a time.
I should also mention that this is only 1 indicator (although quite a reliable one) that is screaming bearish....it's a mixed bag with the host of other indicators I follow which is why I'm taking things 1 day a time for now.
Does this mean we are going to see massive drops like we did following the periods I just mentioned? Quite possibly yes, but not neccessarily. In bear markets, greed/froth, such as what this indicator measures, gets punished severely because the natural evironment in a bear market is fear not greed given that fundamentals are deteriorating. In bull markets, investors don't get punished as much for being greedy (until the very end of it) because optimism is the natural emotion. Therefore, it could very well be the case that the market has a much milder decline this time around compared to the prior 4 periods I highlighted. That's of course we are assuming we are in a bull market. Only hindsight will allow us to know for sure.
Thus, for now it is safe to assume in my opinion that any rallies from here will be quite limited, i.e. won't exceed the high put in June. It also safe to assume that we haven't seen the low point yet of this decline. Be advised like I said before that the market isn't going to make things easy for the bears to captialize because bears by nature are weak handed. Expect to see plenty of headfake rallies and declines to create maximum frustration.
The topping process could very well last another week or 2. I suspect we could see break down of this widely followed head and shoulder's patter to about 880-875 or so followed by a vicious snap back to 900 but that's just a guess. I'm taking things 1 day at a time.
I should also mention that this is only 1 indicator (although quite a reliable one) that is screaming bearish....it's a mixed bag with the host of other indicators I follow which is why I'm taking things 1 day a time for now.
Subscribe to:
Posts (Atom)